In this example, we will create a master/detail report displaying customer cost versus revenue by period for two different datasources.
First, we must create another datasource from which to pull the data.
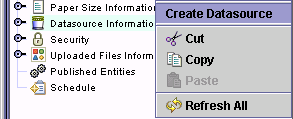
In the Explorer Tree, select the Datasource Information object.
Right click on the Datasource Information object and select New->Datasource.
The Create New Datasource wizard will be displayed.
In the Name property, enter the name of the datasource. For this example, enter DEMO as the name of the datasource.
In the Type property, select Oracle 9i as the database type.
In the Login property, enter the log in used to access this database. For this example, enter fusion.
In the Password property, enter the password used to access this database.
Press the Ok button to create the datasource.
The datasource is created, but needs some modifications before it will retrieve data.
In the Description
property, you can enter a user-defined description of the datasource.
For this example, enter Xephr Demo database.
In the Server
property, the name of the server on which the database is installed needs
to be entered. The fusion database is installed
on the server named dev9, so for this example, enter dev9.

In the SID
property, enter the service identifier (SID) for the database. The
service identifier for the fusion database is dev9.

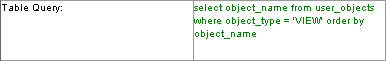
In the Table
Query property, enter the SQL statement used to populate the list
of tables available when creating a new block. Since
all of our blocks need to be generated from views, and the objects in
the oracle database are stored in the user_objects table, enter the following
statement:
select object_name from user_objects where object_type = 'VIEW' order
by object_name
In the Initial
Connections property, enter the number of database connections
with to start with in the connection pool when the system is started.
Users share the connections created in the connection pool, and this is
the number of connections created when the first connection is made. For
this example, we will leave the setting to its default of 2 initial database
connections. For more information on the database
connection pool, see the Database
Connection Pool section.

In the Max
Size property, enter the maximum number of connections that can
be created in the connection pool. This is the
total number of connections needed during peak system usage. For
this example, we will leave the setting to its default of a maximum of
10 connections. For more information on the database connection pool,
see the Database
Connection Pool section.

In the Min
Size property, enter the minimum number of connections that can
exist in the connection pool. This is the lowest
number of connections that can exist when the connection pool is shrunken
during low usage periods. For this example, we
will leave the setting to its default of a minimum of 0 connections. For more information
on the database connection pool, see the Database
Connection Pool section.

Press the Save
 button in the main toolbar to save your new datasource.
The next step is to create the new report, now that the second datasource has been created.
Select the Group Information object. Expand it, and select the group to which you wish to add the new report entity.
Right click on the group and select
New->Wizard->Entity.
Click on the Report
bullet.
Click on the Next button at the bottom right of the screen.
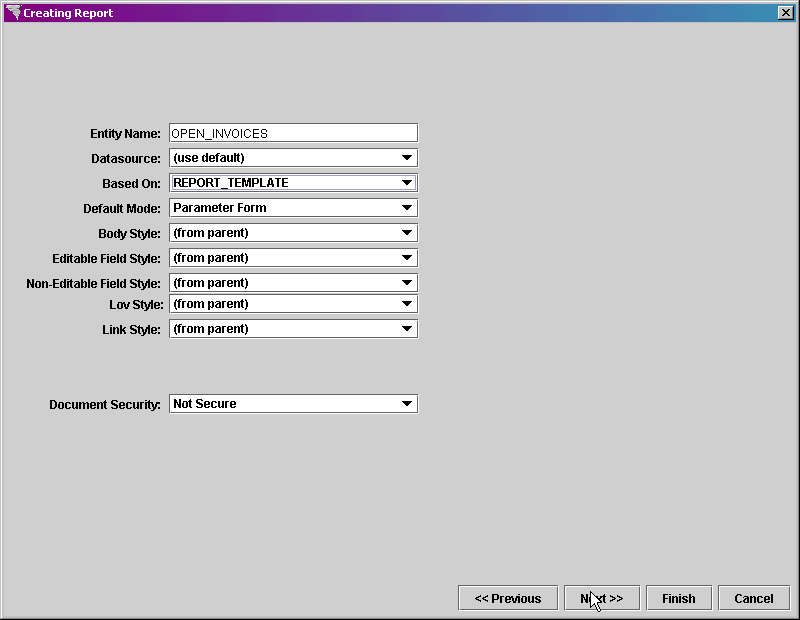
In the Entity Name property, type CUST_HIST_BY_PERIOD as the entity name.
Leave the Datasource property set to (use default) since we are going to define the datasource used by block.
In the Based On property, select REPORT_TEMPLATE, which is the template that we created earlier.
Set the Default Mode property to Run Report, since we are not going to use the parameter form for this report.
Leave the Body Style set to (from parent).
Leave the Field Style set to (from parent).
Leave the Link Style set to (from parent).
Leave the Paper Size set to US_LETTER.
Leave the Document
Security set to Not Secure.
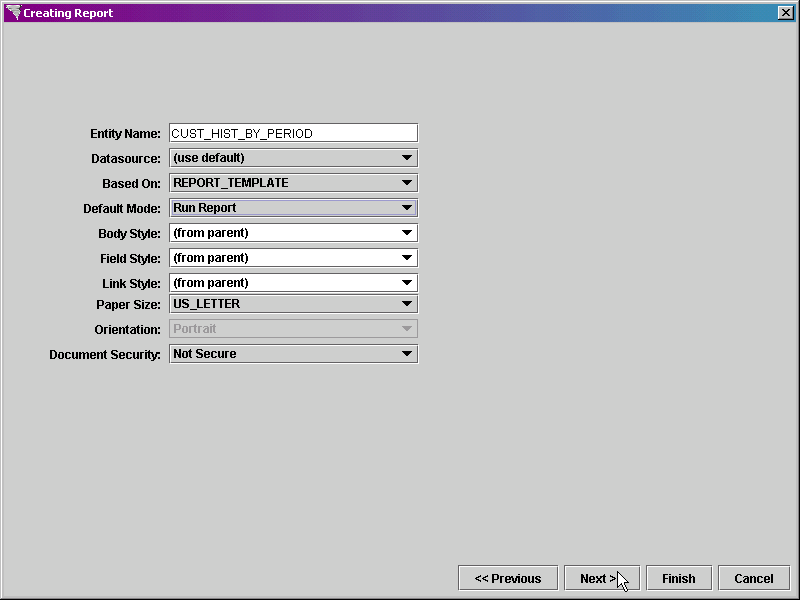
Click on the Next button at the bottom right of the screen.
In the Block Name property, enter MASTER as the name of the block.
Leave the Block Type property set to Standard Block.
Leave the Datasource property set to (use default).
Set the Query Type property to Complex Query.
Leave the Create Heading checkbox set to off since we do not want a heading to be created for the block.\
In the Scheme Selection section, set the Form bullet to on since we want the labels and database fields displayed in the same block.
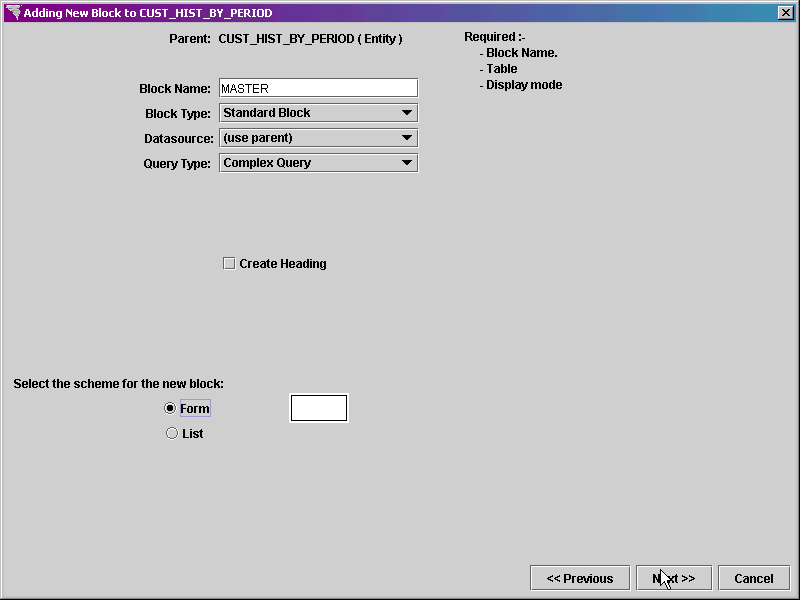
Click on the Next button at the bottom right of the screen.
The Setting Complex Query properties screen is displayed.
When the Query Type is Complex Query for any block, you must enter the select statement, filters, and ordering and grouping information manually, defining the columns to be selected and the table from which the columns will be selected. The query we are entering will select the year and period and join them into one value that will be displayed.
In the Select
Statement property, enter
select to_char(ceil(a.nds_row/12)+to_number(to_char(sysdate,'YYYY')-2))
||ltrim(to_char(mod(a.nds_row-1,12)+1,'00'))
year_month from nds_counter a
In the Filters
property, to have only periods from 2003 displayed, enter
where a.nds_row < 16
In the Ordering
and Grouping property, enter
order by year_month
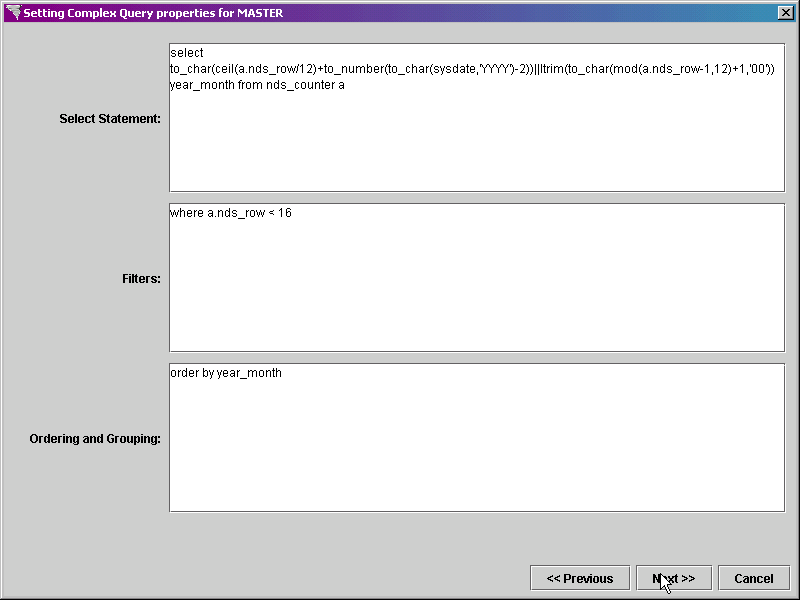
Click on the Next button on the bottom right of the screen to continue.
The Adding Fields screen is displayed, including the columns defined in the complex query.
Set the Key,
Field, and Column
checkboxes to on for the YEAR_MONTH column.
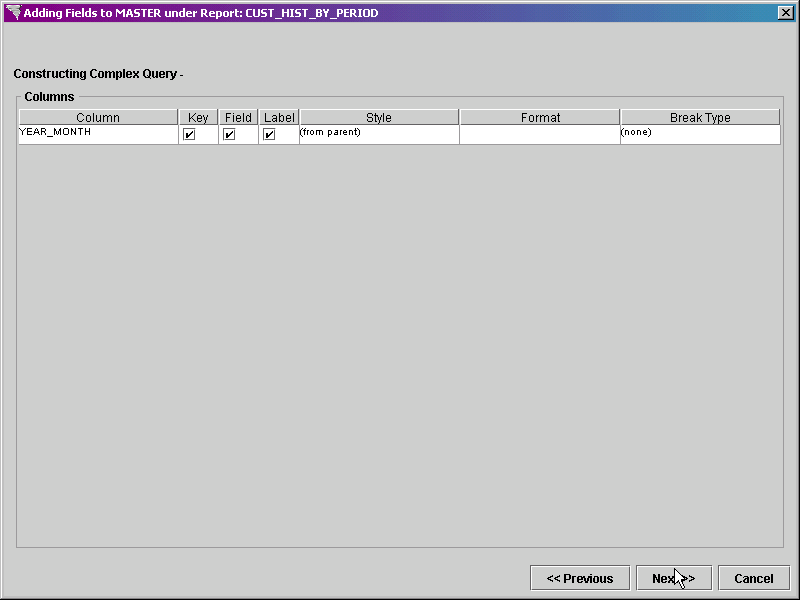
Click on the Next button on the bottom right of the screen to continue.
The Ordering
Fields screen is displayed next. We only
have one column in this query.
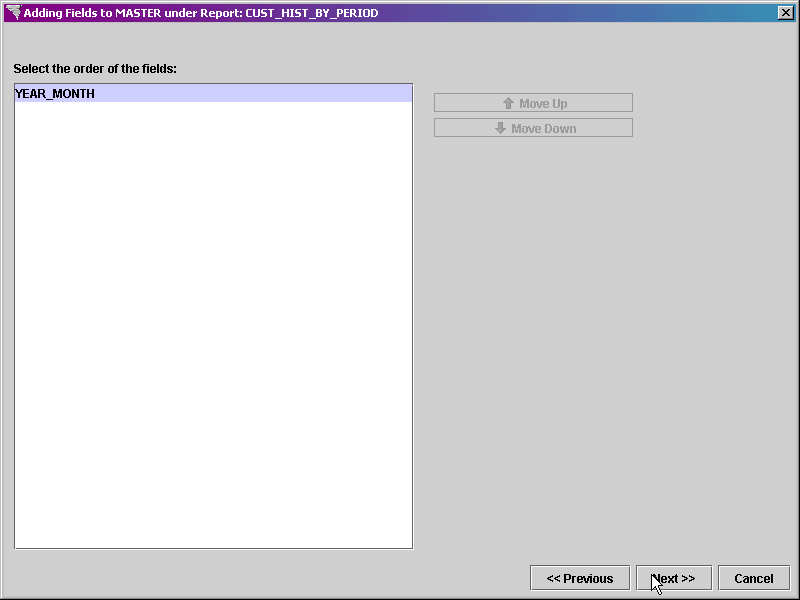
Click on the Next
button on the bottom right of the screen to continue.
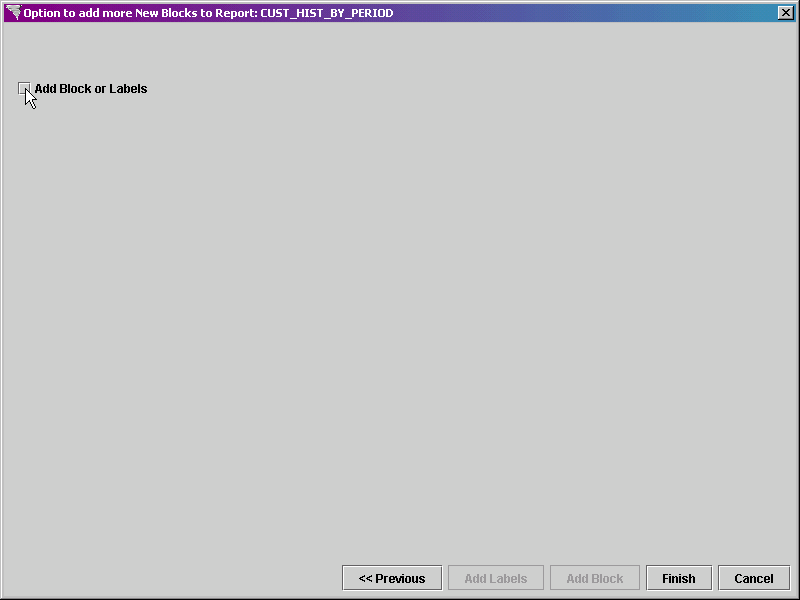
The Option to Add More screen is displayed next. Next we need to add the first block that will display customer sales and cost information for the PRODUCTION datasource by period. Set the Add Block or Labels checkbox to on. The entity in its current form will be displayed.
Expand the CUST_HIST_BY_PERIOD entity
and left click on the MASTER block to select it.
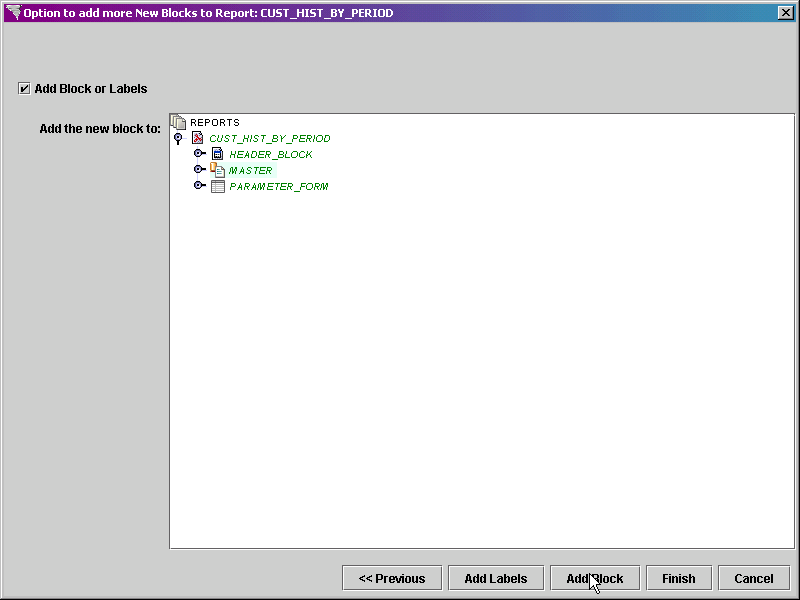
Click on the Add Block button at the bottom of the screen.
In the Block Name property, enter PRODUCTION_CUST_HIST as the name of the block.
In the Block Type property, select Standard Block.
Set the Datasource property to PRODUCTION, because we want the data for this block to be taken from that datasource.
Set the Query Type property to Simple Query.
In the Table property, select the name of the table or view from which the data will be obtained. Since our datasource is set to use the Oracle 9i database for NDS Applications, we will select the view CUST_HIST_VW2_SUM.
Leave the Create Heading checkbox set to on as we want a heading label to be generated for this block.
In the Scheme
Selection section, set the List
bullet to on as we are displaying
multiple records and the labels and fields need to be displayed in different
blocks.
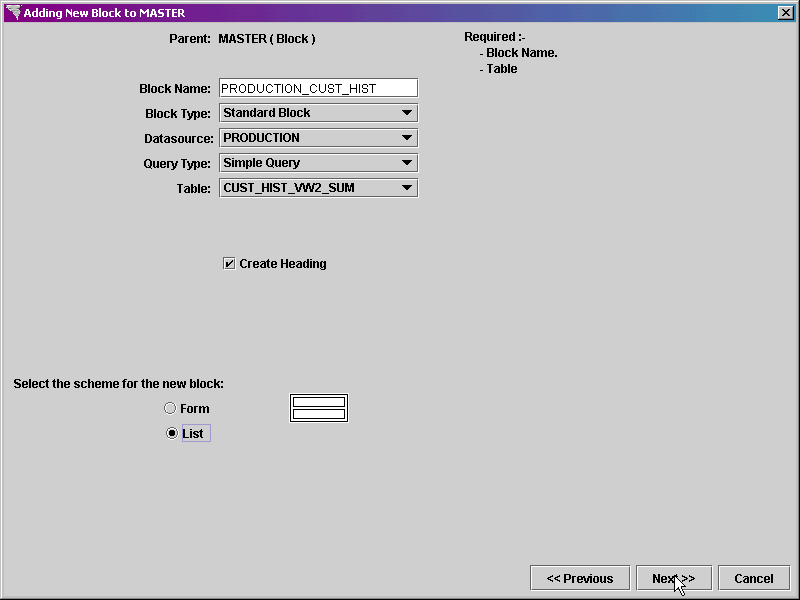
Click on the Next button at the bottom of the screen.
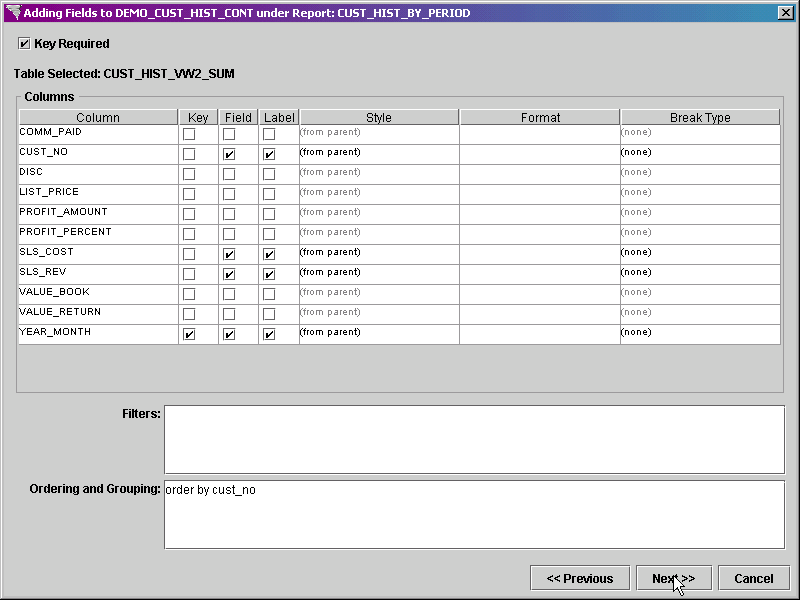
The Adding Fields screen is displayed. Select the columns that you wish to include in the report.
Click on the name of the column
to select both the Field and Label checkboxes for that column. Do
this for the following columns
CUST_NO
SLS_COST
SLS_REV
YEAR_MONTH
A key must be selected to continue. Set the Key checkbox to on for the YEAR_MONTH field as we wish to join this block to the MASTER block by that value.
In the Filters property, you could enter code to restrict the data returned from the table. We do not need any additional restrictions, so leave this property empty.
In the Ordering and
Grouping property, you can enter code to determine the order in
which the data is displayed in the report. We want
to display the data in order by customer number. Enter
the following:
order by cust_no
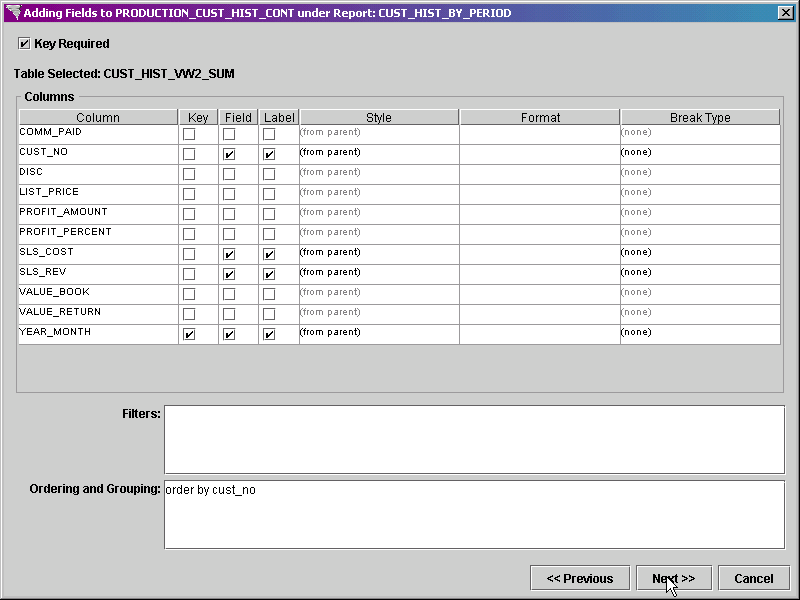
Click on the Next button at the bottom right of the screen.
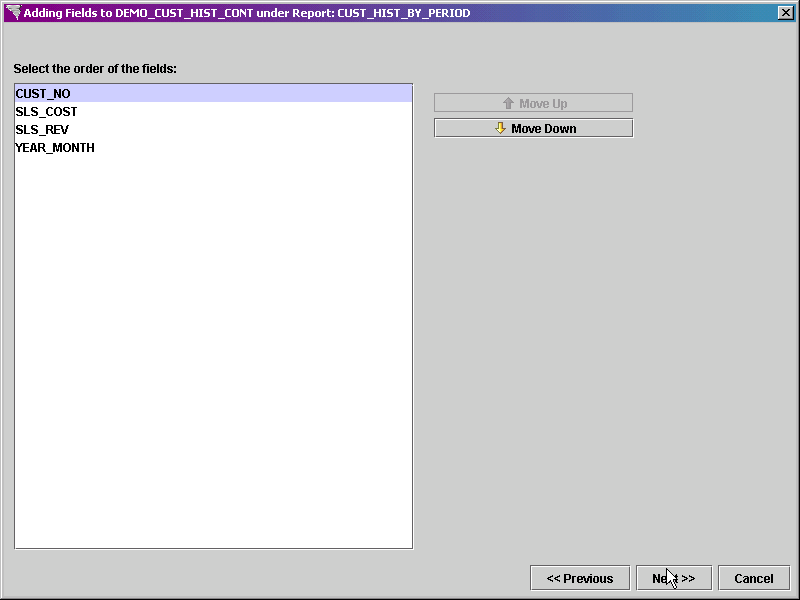
The Ordering Fields
screen is displayed next. The columns are initially
ordered as they were listed on the previous screen. To
move a field up or down, highlight the desired field by selecting it,
and click on the Move Up or Move Down buttons on the right of the screen.
These columns are in the proper order.
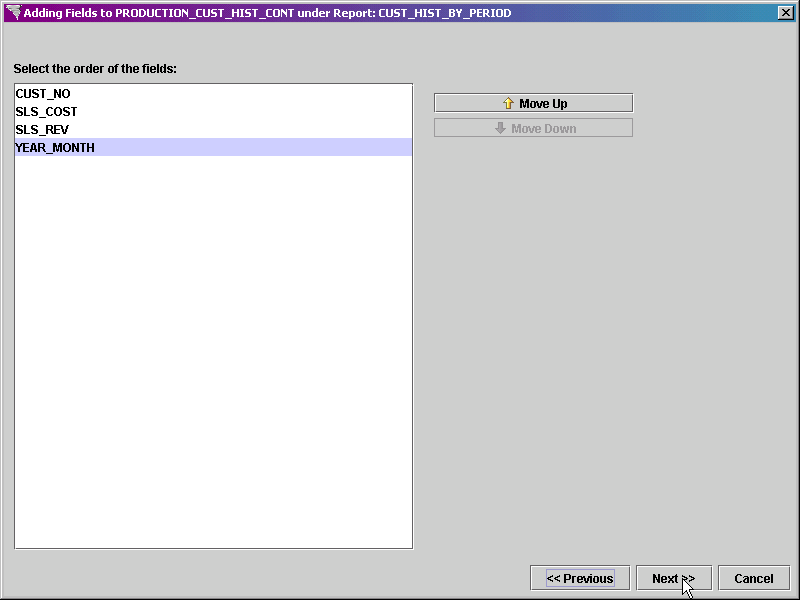
Click on the Next
button when you have finished moving the fields.
The Option to Add More screen is displayed next. Next we need to add the first block that will display customer sales and cost information for the PRODUCTION datasource by period. Set the Add Block or Labels checkbox to on. The entity in its current form will be displayed.
Expand the CUST_HIST_BY_PERIOD entity and left click
on the MASTER block to select it.
Click on the Add Block button at the bottom right of the screen.
In the Block Name property, enter DEMO_CUST_HIST as the name of the block.
In the Block Type property, select Standard Block.
Set the Datasource property to DEMO, because we want the data for this block to be taken from that datasource.
Set the Query Type property to Simple Query.
In the Table property, select the name of the table or view from which the data will be obtained. Since our datasource is set to use the Oracle 9i database for NDS Applications, we will select the view CUST_HIST_VW2_SUM.
Leave the Create Heading checkbox set to on as we want a heading label to be generated for this block.
In the Scheme
Selection section, set the List
bullet to on as we are displaying
multiple records and the labels and fields need to be displayed in different
blocks.
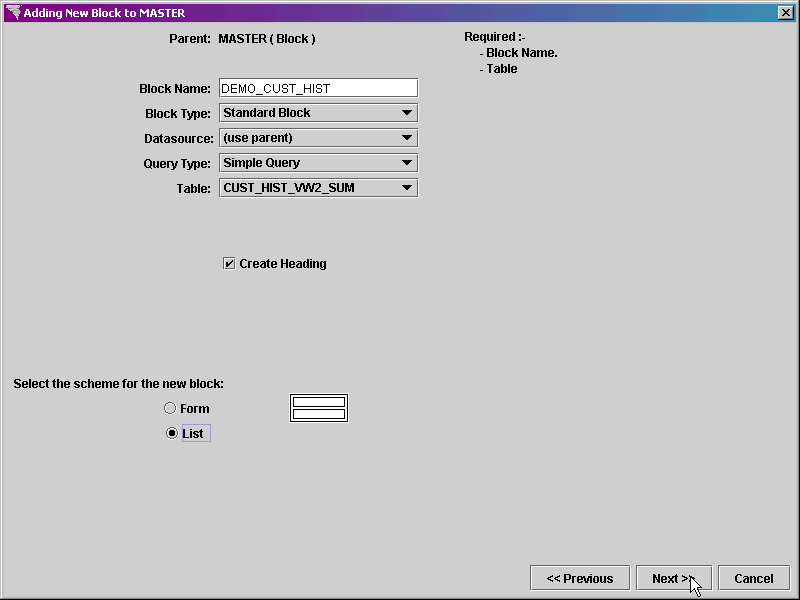
Click on the Next button at the bottom of the screen.
The Adding Fields screen is displayed. Select the columns that you wish to include in the report.
Click on the name of the column
to select both the Field and Label checkboxes for that column. Do
this for the following columns
CUST_NO
SLS_COST
SLS_REV
YEAR_MONTH
A key must be selected to continue. Set the Key checkbox to on for the YEAR_MONTH field as we wish to join this block to the MASTER block by that value.
In the Filters property, you could enter code to restrict the data returned from the table. We do not need any additional restrictions, so leave this property empty.
In the Ordering and
Grouping property, you can enter code to determine the order in
which the data is displayed in the report. We want
to display the data in order by customer number. Enter
the following:
order by cust_no
Click on the Next button at the bottom right of the screen.
The Ordering Fields
screen is displayed next. The columns are initially
ordered as they were listed on the previous screen. To
move a field up or down, highlight the desired field by selecting it,
and click on the Move Up or Move Down buttons on the right of the screen.
These columns are in the proper order.
Click on the Next button when you have finished moving the fields.
The new entity is added to the initially selected group.
Click on the Save
button in the main toolbar to save the new report entity.
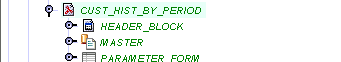
In the Explorer Tree, left click on the CUST_HIST_BY_PERIOD report entity and display the property sheet.
In the Title
property, enter the title for this report - Customer History by Period

All other settings come from the report template.
Expand the HEADER_BLOCK block next, select the HEADER_TEXT field, and display the property sheet.
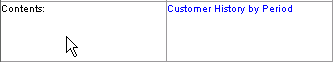
In the Contents
property, enter the name of the new report - Customer History by Period.
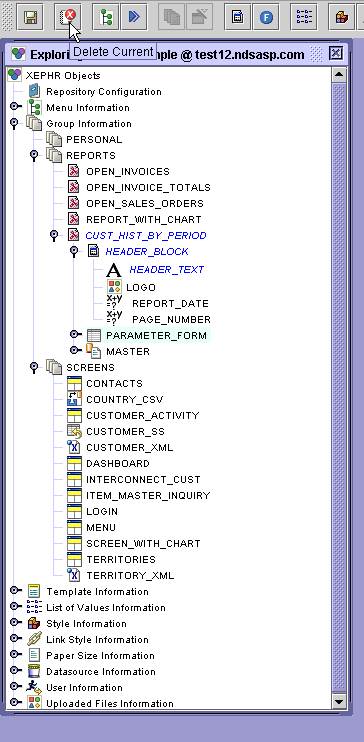
We do not need a parameter form for this report, so we are going to delete it.
Left click on the PARAMETER_FORM block in the Explorer
Tree. Then, click on the Delete
Record  button in the main toolbar to delete it.
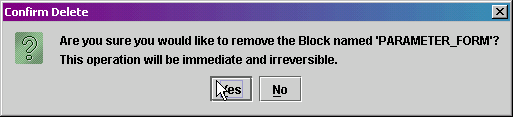
The Confirm Delete
pop-screen will be displayed. Click Yes.
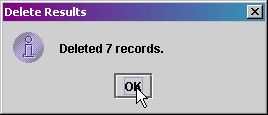
The Delete Results
pop-screen will be displayed. Click Ok.
Click on the Save
button in the main toolbar to save the changes.
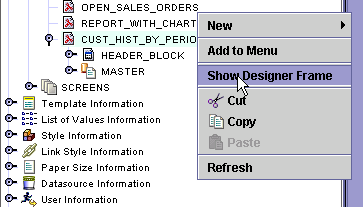
Now, right click on the CUST_HIST_BY PERIOD entity and
right click. Select Show
Designer Frame from the menu.
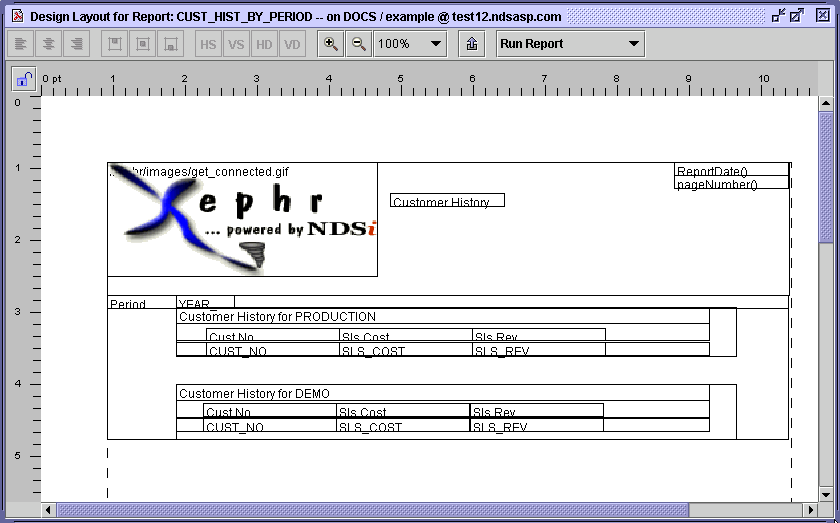
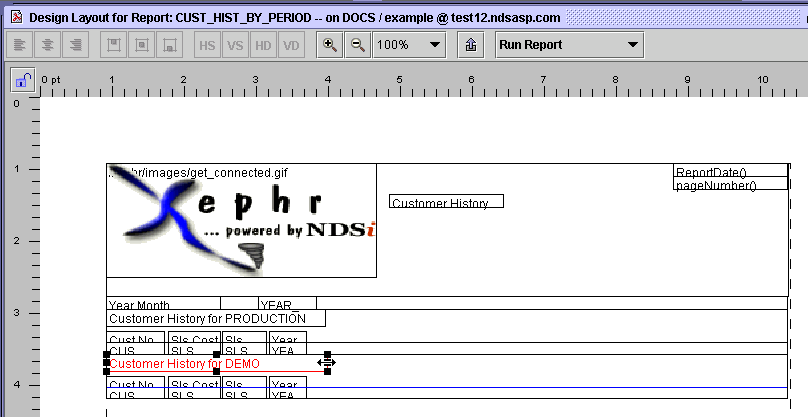
Within the Designer Tool, you can move, align, and resize the objects. For specific instructions on the Designer Tool and its functionality, see the Designer Tool section.
When the Designer Tool
is displayed, expand it so that you can see the entire entity. The
Designer Tool displays the default
mode of the entity selected. The pop-list in the
upper right of the Designer Tool
indicates that we are viewing the lay out of Run
Report.
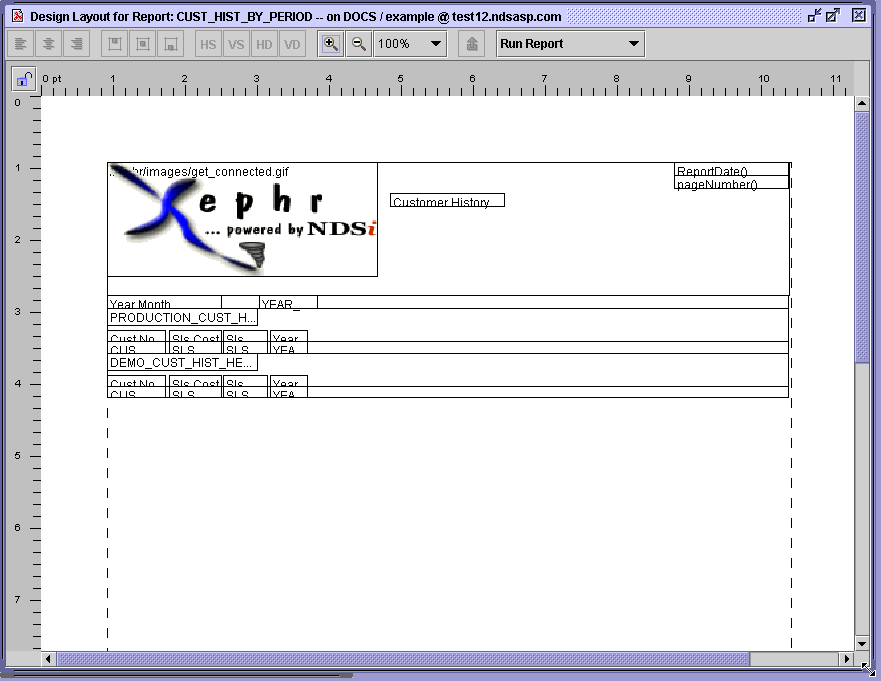
The modifications that we need to make include entering header text for both blocks, assigning format masks to the cost and revenue fields, and hiding the year_month column in the detail blocks, since it's already displayed in the header blocks.
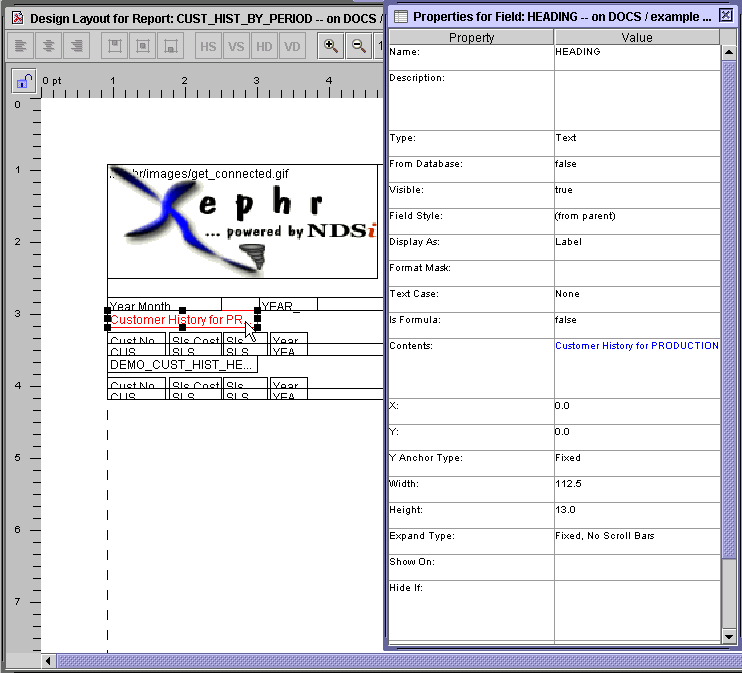
Left click on the field that reads PRODUCTION_CUST_H... This is the header field.
Double click to display the property sheet.
In the Contents
field, enter Customer History for PRODUCTION.
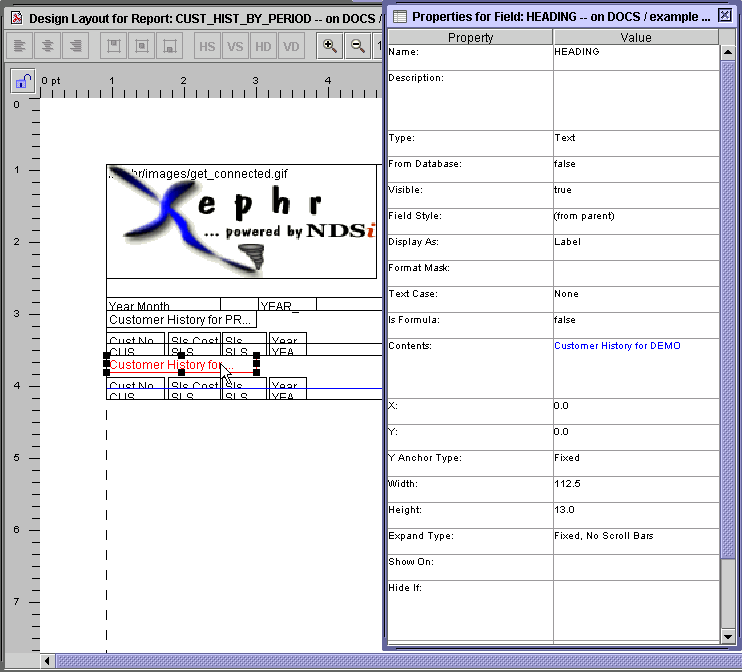
Left click on the field that reads DEMO_CUST_HIST_HE... This is the header field.
Double click to display the property sheet.
In the Contents
field, enter Customer History for DEMO.
These fields are displayed a little small. In
the Designer Tool, drag the right edge to make them larger.
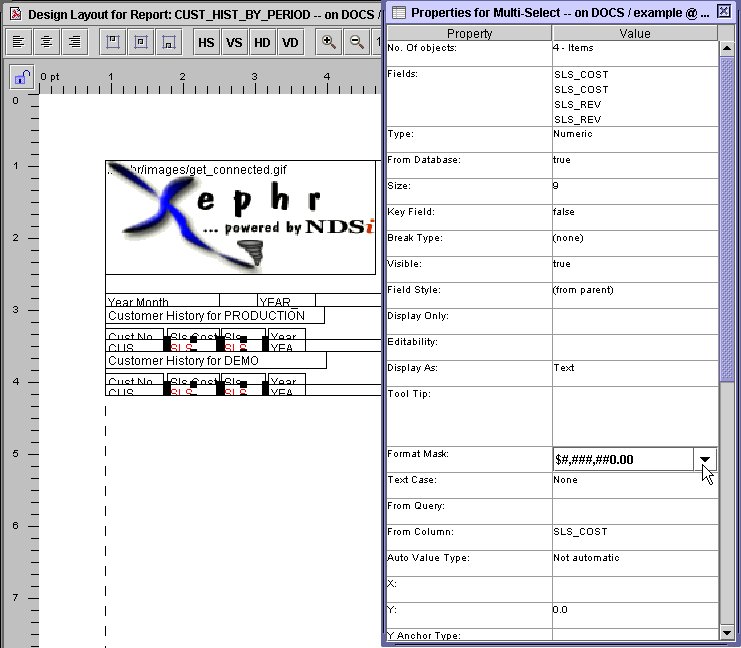
The SLS_COST and SLS_REV fields for both blocks need to be assigned format masks. Hold down the Shift key on the keyboard and select them. Double click to display the property sheet.
In the Format Mask
property, select $#,###,##0.00
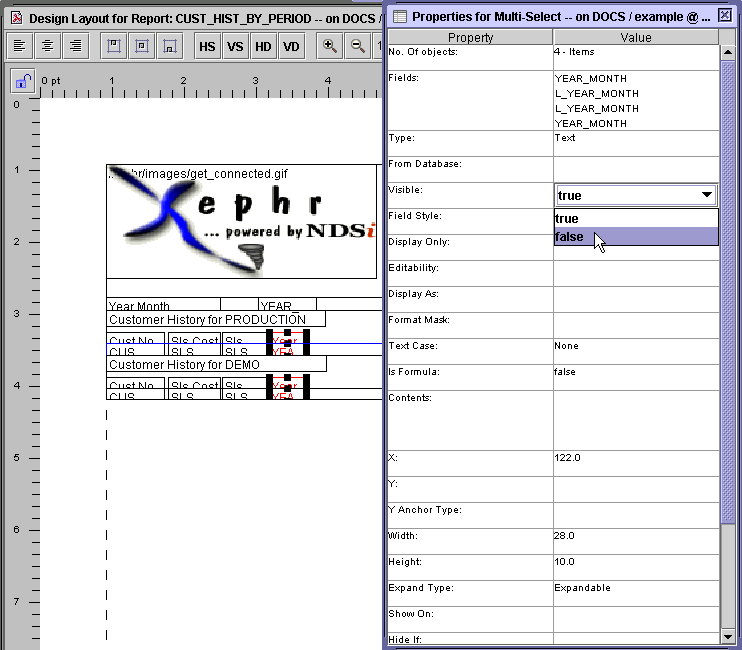
In the Designer Tool, hold down the Shift key on the keyboard and select the two fields that read Year and the two fields that read YEA.
Display the property sheet.
Set the Visible
property to false.
Click on the Save
button in the main toolbar to save the changes.
To test the new report entity, highlight it by selecting
it in the Explorer Tree, and click on the Run
 button in the main toolbar.
Click on the Run
button.
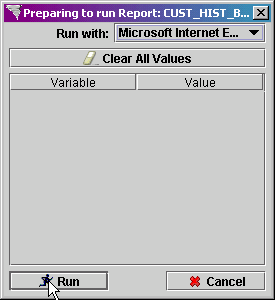
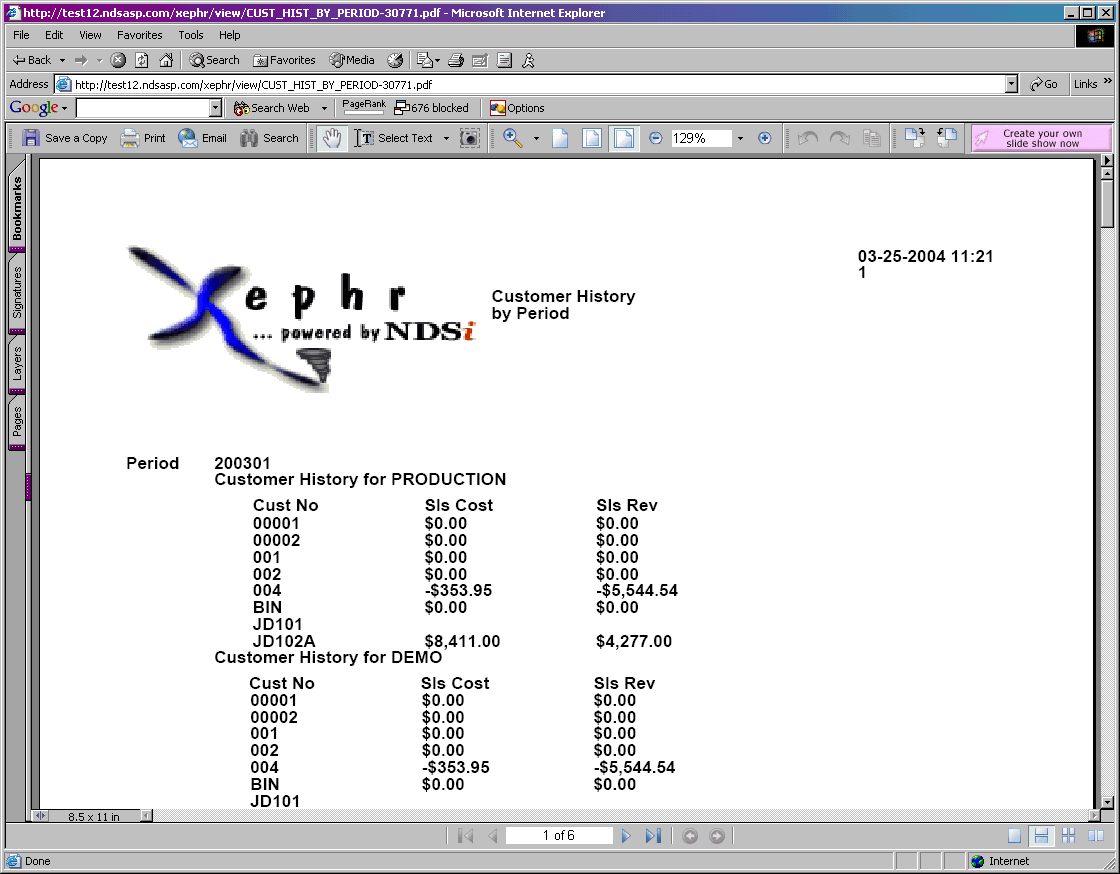
The report will be displayed in the browser.
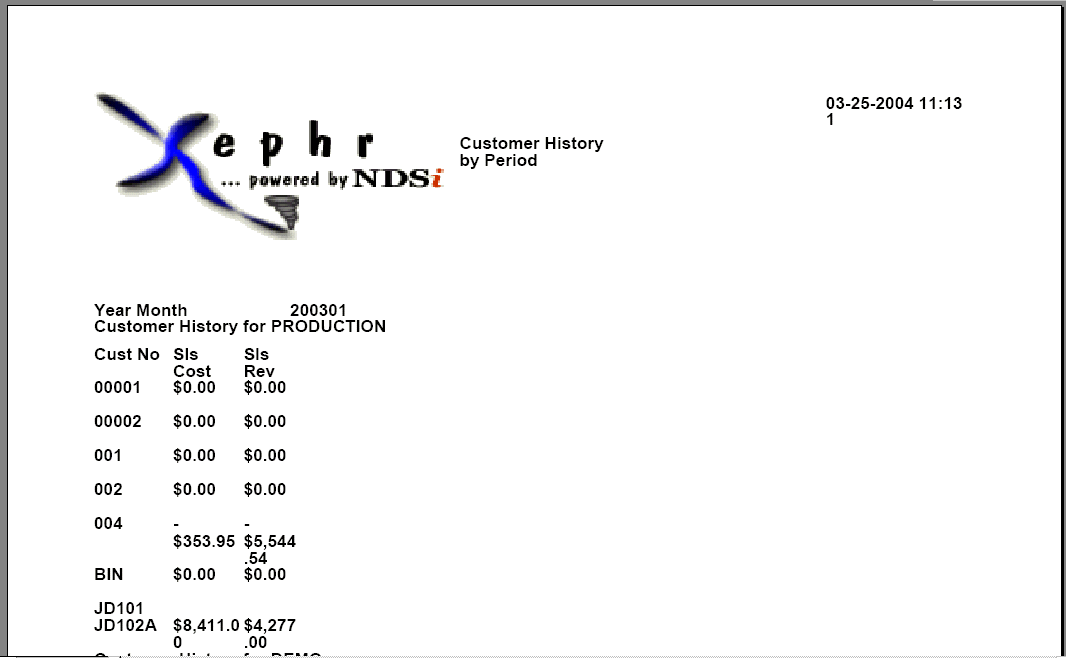
Additional formatting changes can be made to the layout
so that the final version looks like this: